Last week we formulated our thesis and went on to capture the data to (dis-) prove our assumption. Today we clean the data file, turn it into a graph and check the merit of our thesis.
This post is part of my journey to learn Python. You find the code for this post in my PythonFriday repository on GitHub.
Complete the data by hand
Our CSV file from YouTube ended up with 2200 “Unknown” values for the conference field. Before we do any improvement of this data, we make a copy so that we do not accidentally overwrite it when we run our extractor again:
|
1 |
cp .\ndc_talks_youtube.csv .\ndc_talks_manually_fixed.csv |
The cumbersome work of scrolling through the YouTube channel of NDC is unfortunately the fastest way we have. While scrolling through the videos, we check if we need to fix the conference for that specific video in our CSV file.
While doing that, I checked if the video is a talk or not. If not, I changed the type to “other“.
When we are done, our check code should give us a better list of conferences:
|
1 2 3 4 |
import pandas as pd df = pd.read_csv('ndc_talks_manually_fixed.csv') print(df['Conference'].value_counts()) |
|
1 2 3 4 5 6 7 8 9 10 11 |
Conference NDC Oslo 2017 175 NDC Oslo 2018 174 NDC Oslo 2019 172 NDC London 2017 157 NDC Oslo 2023 156 NDC Sydney 2017 142 NDC Oslo 2020 137 NDC Sydney 2018 129 NDC Oslo 2022 126 ... |
It took a while, but now we have a useful data set that we can analyse.
Filter the data
We are interested in the talks of the NDC Oslo conference and how they changed over the years. NDC Oslo has a special format for short talks, called Lightning Talks. They should fit into a 10 to 15 minutes slot. Since they are by design shorter, we exclude them from our data. Another outlier for the talk duration are the workshop slots who fill the space of two regular talk slots. By cutting off talks that are shorter than 20 minutes or larger than 75 minutes, we get a list of useful entries:
|
1 2 3 4 |
talks = df[df.Type == 'talk'] oslo_talks = talks[talks.Conference.str.contains("NDC Oslo")] oslo_talks = oslo_talks.query('`DurationInMinutes` < 75 & `DurationInMinutes` > 20') oslo_talks['Conference'].value_counts() |
This gives us 996 entries we can work with:
|
1 2 3 4 5 6 7 8 9 10 |
Conference NDC Oslo 2017 162 NDC Oslo 2018 159 NDC Oslo 2019 154 NDC Oslo 2023 140 NDC Oslo 2022 113 NDC Oslo 2021 113 NDC Oslo 2020 112 NDC Oslo 2016 43 Name: count, dtype: int64 |
Plotting the data
With Seaborn we can create a box plot and add a vertical line that aligns with the median duration of the talks in 2023:
|
1 2 3 4 5 6 7 |
import matplotlib.pyplot as plt import seaborn as sns ax = sns.boxplot(oslo_talks, x='DurationInMinutes', y='Conference') ax.axvline(x=55, color='orange') |
We can see that the median (the middle value) of the talk duration for 2023 is the same as in 2022 and 2018:

It was lower than in the other years, but it means that there are still 50% of the talks that are longer than 55 minutes. Which is a value that is still better than most other conferences can offer. And it disproves one of the 3 measurements I expected to be true right away.
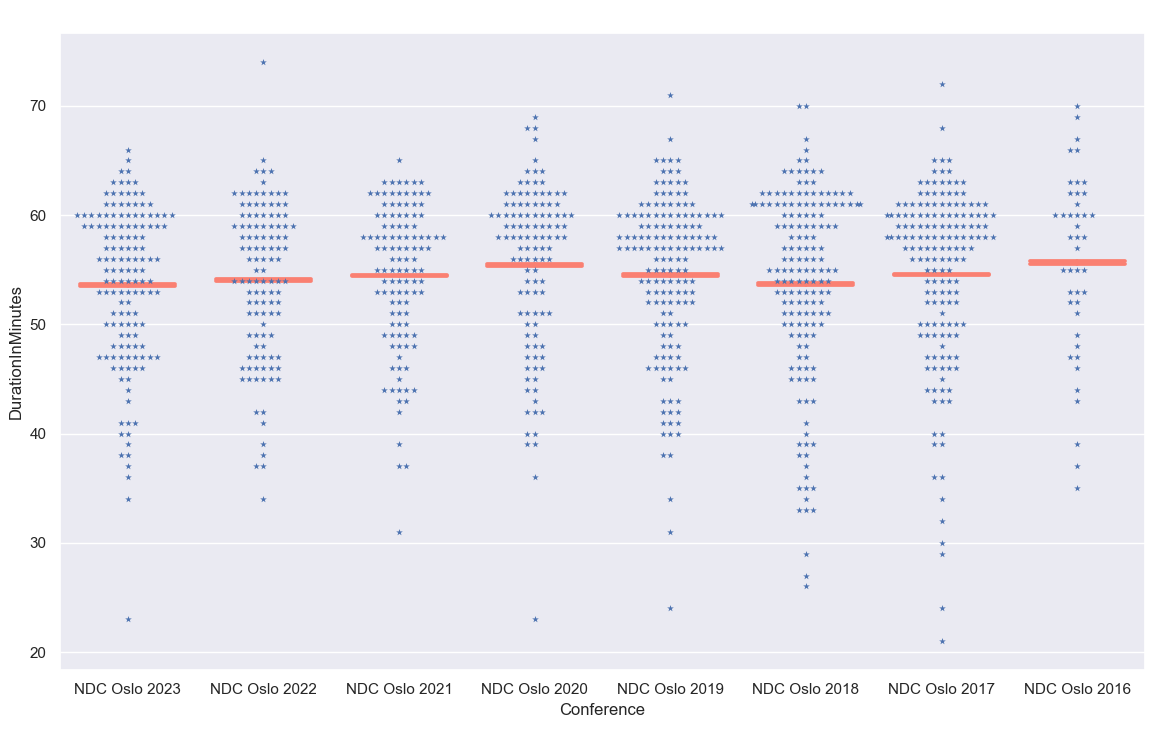
With a swarm plot we can see all the talks and how they are distributed. This time we add a red horizontal line to mark the mean value of the duration (the average of all the talks of a year):
|
1 2 3 4 5 6 7 8 9 10 11 12 13 |
sns.set(rc={'figure.figsize':(14,8.27)}) spec = dict(x="Conference", y="DurationInMinutes", data=oslo_talks) sns.swarmplot(**spec, marker="*") sns.pointplot(**spec, join=False, errorbar=('ci', 10), capsize=0.7, scale=0, color='salmon') |
We can see that the red line for 2023 is slightly lower than it was for 2022 or 2018:
A closer look at the numbers
So far, we could only prove that the talk duration in 2023 is slightly lower but not by much. To figure out the exact values, we need the describe() function of Pandas and group our talks by year:
|
1 2 |
group = oslo_talks.groupby(['Conference']).describe() group.sort_values(by='Conference', ascending=False) |

The mean (average) talk duration was in 2023 with 53.64 minutes the shortest in our data set for NDC Oslo. However, the difference to 2018 with 53.72 minutes is less than 5 seconds.
For the talks below 50 minutes, we can filter for duration and group our data set by the conference:
|
1 |
oslo_talks.query('DurationInMinutes < 50')['Conference'].value_counts() |
|
1 2 3 4 5 6 7 8 9 10 |
Conference NDC Oslo 2023 38 NDC Oslo 2018 38 NDC Oslo 2017 37 NDC Oslo 2019 34 NDC Oslo 2022 31 NDC Oslo 2021 26 NDC Oslo 2020 25 NDC Oslo 2016 10 Name: count, dtype: int64 |
The result shows that NDC Oslo 2023 is at the top of the list and gets 38 talks below 50 minutes – the same amount as NDC Oslo 2018 had.
Verifying the thesis
If I am right, I expect to find these 3 measurable results for talks at NDC Oslo 2023 compared with the previous years:
- The average duration is lower.
- There are more talks below 50 minutes.
- The median duration is lower.
After crunching the numbers, we can conclude that:
- The average duration of talks is indeed shorter than in the years before, but only at neglectable levels compared to 2018.
- There are the same number of talks below 50 minutes as there were in 2018.
- The median was at the same level as of 2022 and 2018.
We can prove point 1 and disprove point 3 for whatever value of “previous years” we consider. For point 2 we can argue that 2018 is part of “previous years” or not. This ambiguity is a great point to look out for.
Unclear questions are hard to answer, because we can move the goalpost to a value that proves our point. If we cut off our data at NDC Oslo 2019, we get 2 of the 3 points correct. If we keep 2018, it falls to 1 of 3 correct points. We could also argue that “more talks” means relatively more talks and 38 of 140 talks in 2023 is worse than 38 of 159 for 2018.
Wherever we draw the line, there were a lot of short talks but not in the scale I feared.
Lessons learnt
This exercise in extracting data, cleaning it up and analysing it gave me these new insights:
- Indeed, there were a lot of shorter talks at NDC Oslo 2023, but on average only by a neglectable amount.
- Ambiguity in the question creates opportunities to manipulate (or at least push) data into a fitting answer.
- Specialized tools like Scrapetube may be better suited to extract data from a specific place, but their documentation may not be as comprehensive as more general tools.
- The cleaned-up CSV file is a great help to find interesting talks by speakers I so far missed.
- A good corporate design template with the conference (and year) clearly visible is a massive help to a professional appearance – both for the conference and the speaker.
Conclusion
While my gut feeling pointed in the right direction, the difference between NDC Oslo 2023 and the years before is neglectable. I had just bad luck by selecting the talks I attended and there is no meaningful decline in the duration or the quality of the talks. I am looking forward to attend NDC Oslo 2024 (10-14 June 2024 ) with hopefully a bit more luck in picking talks to attend.