5 Key Points for Performance Testing
We covered Bombardier, the tool to run the performance tests and prepared our application to give us useful results. However, that is not enough to get good performance tests. As soon as we start measuring, we run into new problems.
It is time to take a deeper look at the act of measuring itself and what can go wrong if we are not careful.
Document your measurements
We can do our first mistake right away and before we even made the first measurement. If we do not document what we are testing, on what machines our components run and the hardware / software setup of the involved machines, we will have a hard time to reproduce the measurements. Was it on device A or B? Did we run it against the test environment or was it local? All those things you may know at the moment, but can you recall them in all the details in a few weeks from now?
Create your log file and write everything down. It does not need more than a plain text file. You may think about doing that after you found something interesting and worth improving. But should that happen, you will jump right into bugfix mode and forget all about the boring documentation step. But how do you want to verify later that you indeed fixed the problem if you cannot reproduce it? Save yourself that annoying realisation and document your steps as soon as possible.
One measurement is no measurement
If we only take one measurement, we have no way of knowing if that was a realistic value for the performance of our application or not. It may have been the optimal situation where all resources could be used by the application. Or it could have been a busy system that was otherwise occupied when we run our test. We simply cannot know what the situation was with just one measurement. Therefore, we need to make multiple measurements.
Two measurements do not help much either
If you consider two measurements enough to check the box on multiple measurements, you are about to find out that this does not help you much either. If we get one measurement with 10000 requests per second and one that says the application can handle 15000 requests per second, we know what measurement showed a faster application – yet we still do not know what a more realistic value is. It is tempting to go for the higher value, only to figure out later that we cannot measure any improvement after we deployed our performance fix. Did we now really solve a problem? Or may we have made it worse without noticing it?
Another tempting idea is to keep measuring. If we just get tons of measurements, we will solve that problem. Unfortunately, that leads us right to the next problem: our measurements have an impact on the system we measure.
The more we test, the faster is our application?!?
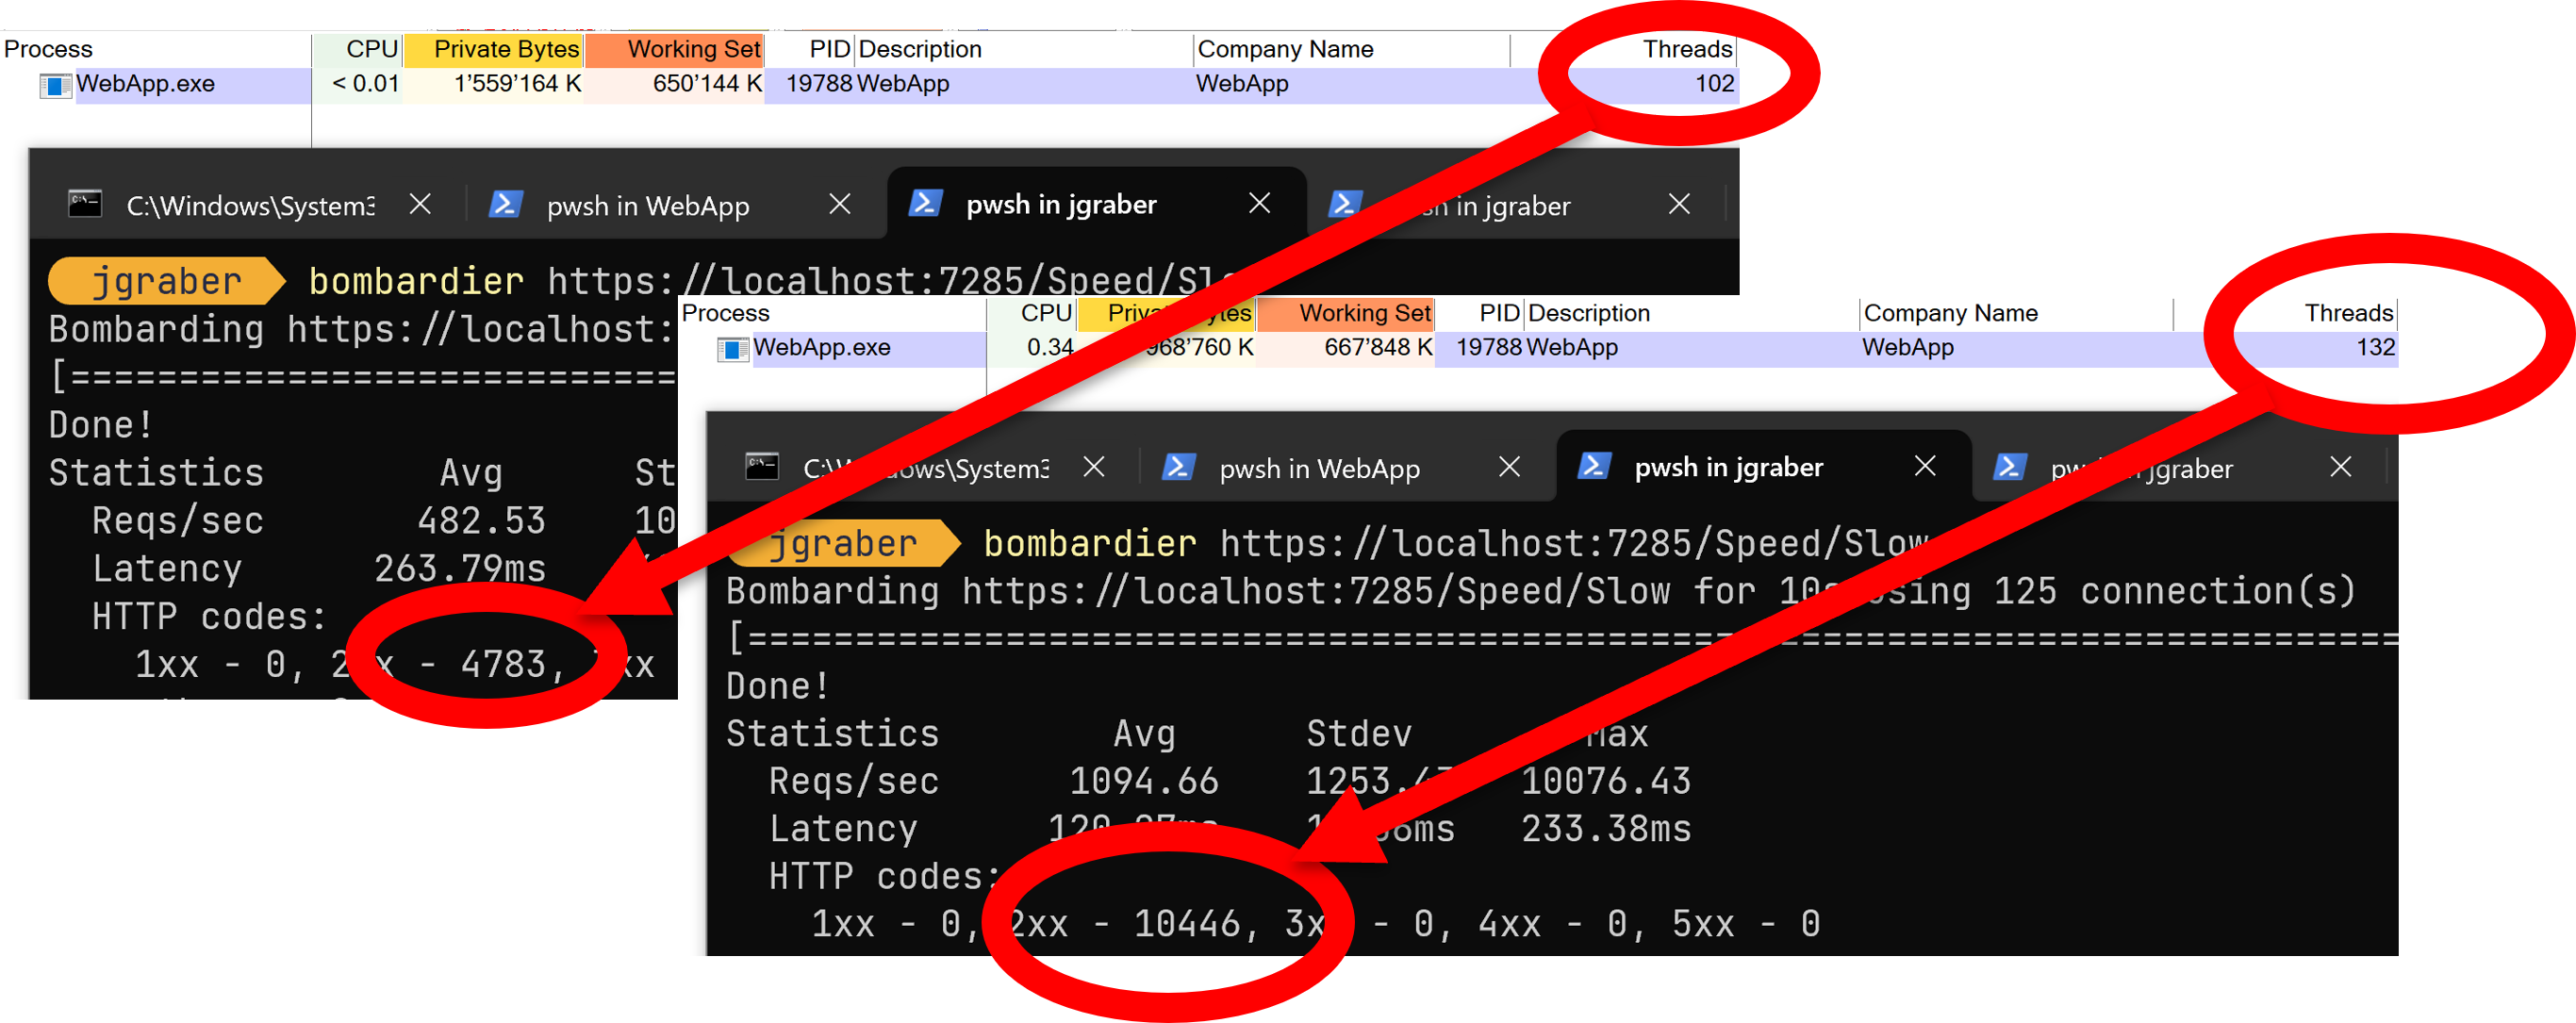
If we run our performance tests against synchronous methods in ASP.NET Core, we are about to see some interesting behaviour. While asynchronous methods stay around the same requests per seconds independently of how often we run the performance tests, the synchronous methods are getting faster. In fact, they improve so much that they sometimes get faster than the asynchronous methods:

I used a synchronous and an asynchronous method in a .Net 8 MVC application who both sleep for 50ms before they render a page with only the method name. Between the test runs I waited a few seconds before I started the next round. Only between run 28 and 29 I waited a minute to give the application time to wind down to see if this has any impact – but that only affected the synchronous method.
The image above shows us that something is off with our measurements. But the measurements are correct; what changed is the infrastructure. When we run the performance tests against Kestrel, we run into the optimisations of this little web server. The more load it gets, the more threads it starts to handle the requests. We can monitor that with a tool like Process Explorer from Sysinternals:
For .Net 9 we get a similar result, but at least with SDK 9.0.101 & 102 with less throughput and more variations for the asynchronous method. It may need a few more updates until we get the same optimisations for .Net 9 as we had in .Net 8.
Repeatable measurements are key
How can we get repeatable measurements when our infrastructure, our systems and our network constantly change? Welcome to the hard part of performance testing. That is one of the main reasons why it is such a pain to make meaningful performance tests. We need to learn a lot about our technology stack and the tools that we use to understand what is going on. But that turned the learning curve into a cliff, and we have nowhere near enough time to learn everything.
Let us take a step back and reiterate what we learned so far in this post. A single measurement is useless, the same is true for too many measurements. We need to find the sweet spot in between, where we get measurements within a close range. What close means depends on your application and the number of moving parts, but for our first steps we can circumvent a clearer definition and use a heuristic approach – close enough is good enough for the time being.
Many side-effects in our environment, like the optimisations for Kestrel, go away if we frequently restart the involved systems. That allows us to follow along this testing loop, in which we repeat these steps 3 times:
- start the application and its dependencies
- run the tests 3 times
- stop the application and its dependencies
This gives us a total of 9 test runs in 3 groups. The values between the first, second or third test may vary, but they should be closer to the corresponding test in the other loops.

Even if we do not get values as close as in the graph above, that approach gives us a repeatable process that we can use again when we want to verify our changes.
Next
If we keep those 5 points in mind when we do our measurements, we may reach repeatable results a lot faster that when we just jump in and flood our applications with requests. Next week we explore our options when it comes to see what goes on inside our application while we run a performance test.