Increase Your Odds to Find a Memory Leak With JetBrains dotMemory
While it is possible to use WinDbg to dive through your memory dump, it takes a lot of knowledge to do so. A much simpler approach is to use a commercial tool like dotMemory from JetBrains. This tool has a graphical interface that allows us to click through the dump and explore what objects lay around.
Installation
The simplest way to install dotMemory is through the JetBrains Toolbox App. The Toolbox is also helpful to keep dotMemory up to date. But be aware that you need to buy a license to use dotMemory.
Load an existing dump file
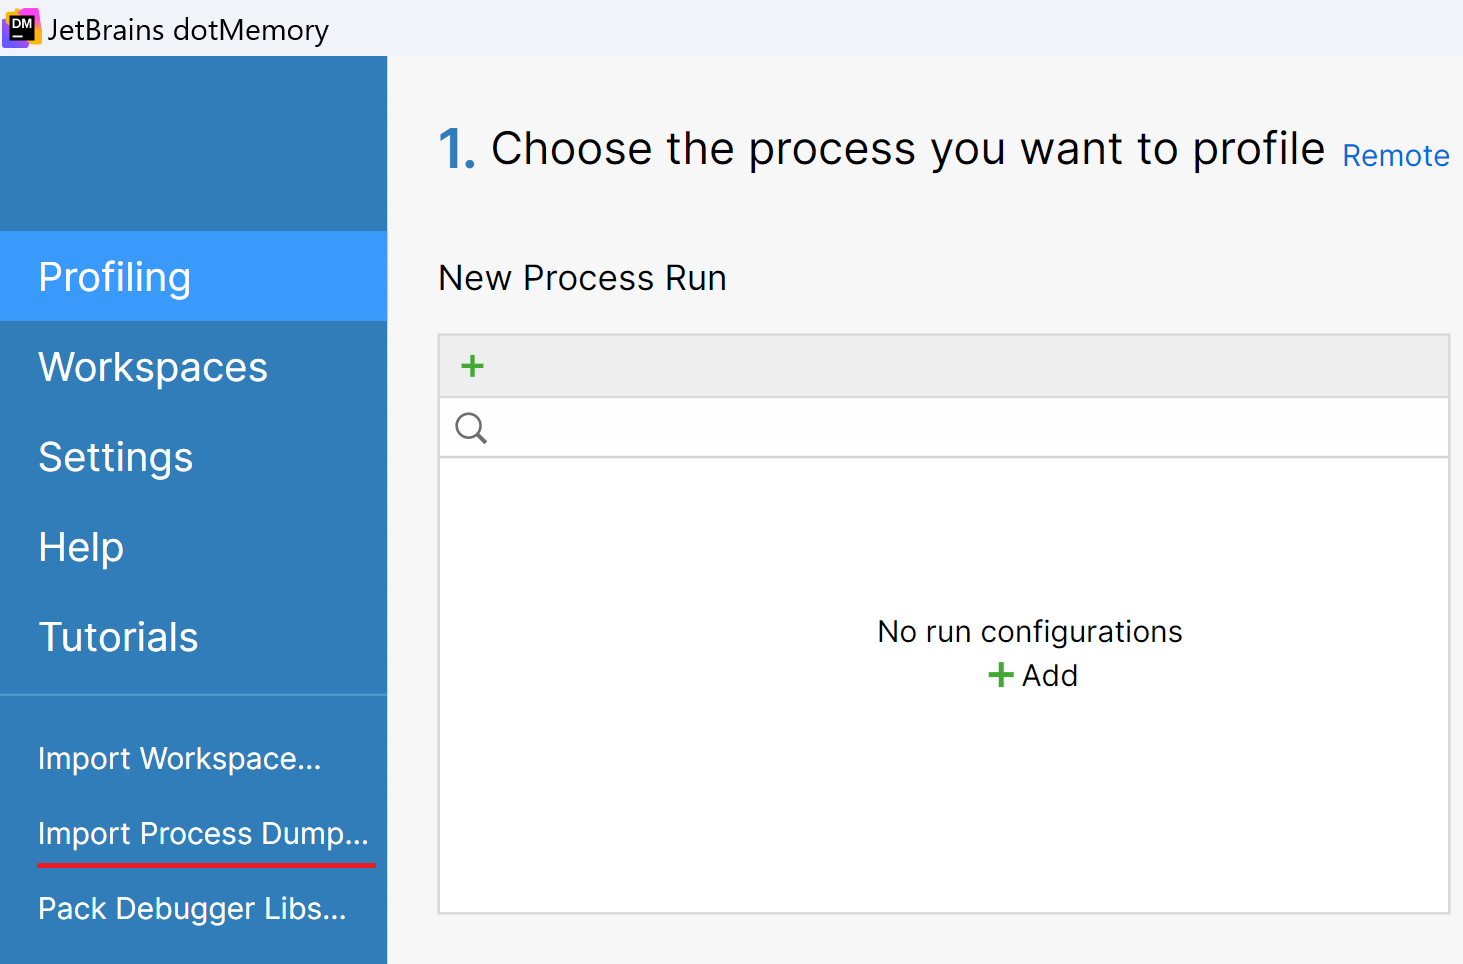
If we already have a dump file, we can load it into dotMemory. For that we select the option Import Process Dump… on the start screen:
It takes a while to load and analyse the dump file. When this work is done, we see an overview of our dump file:
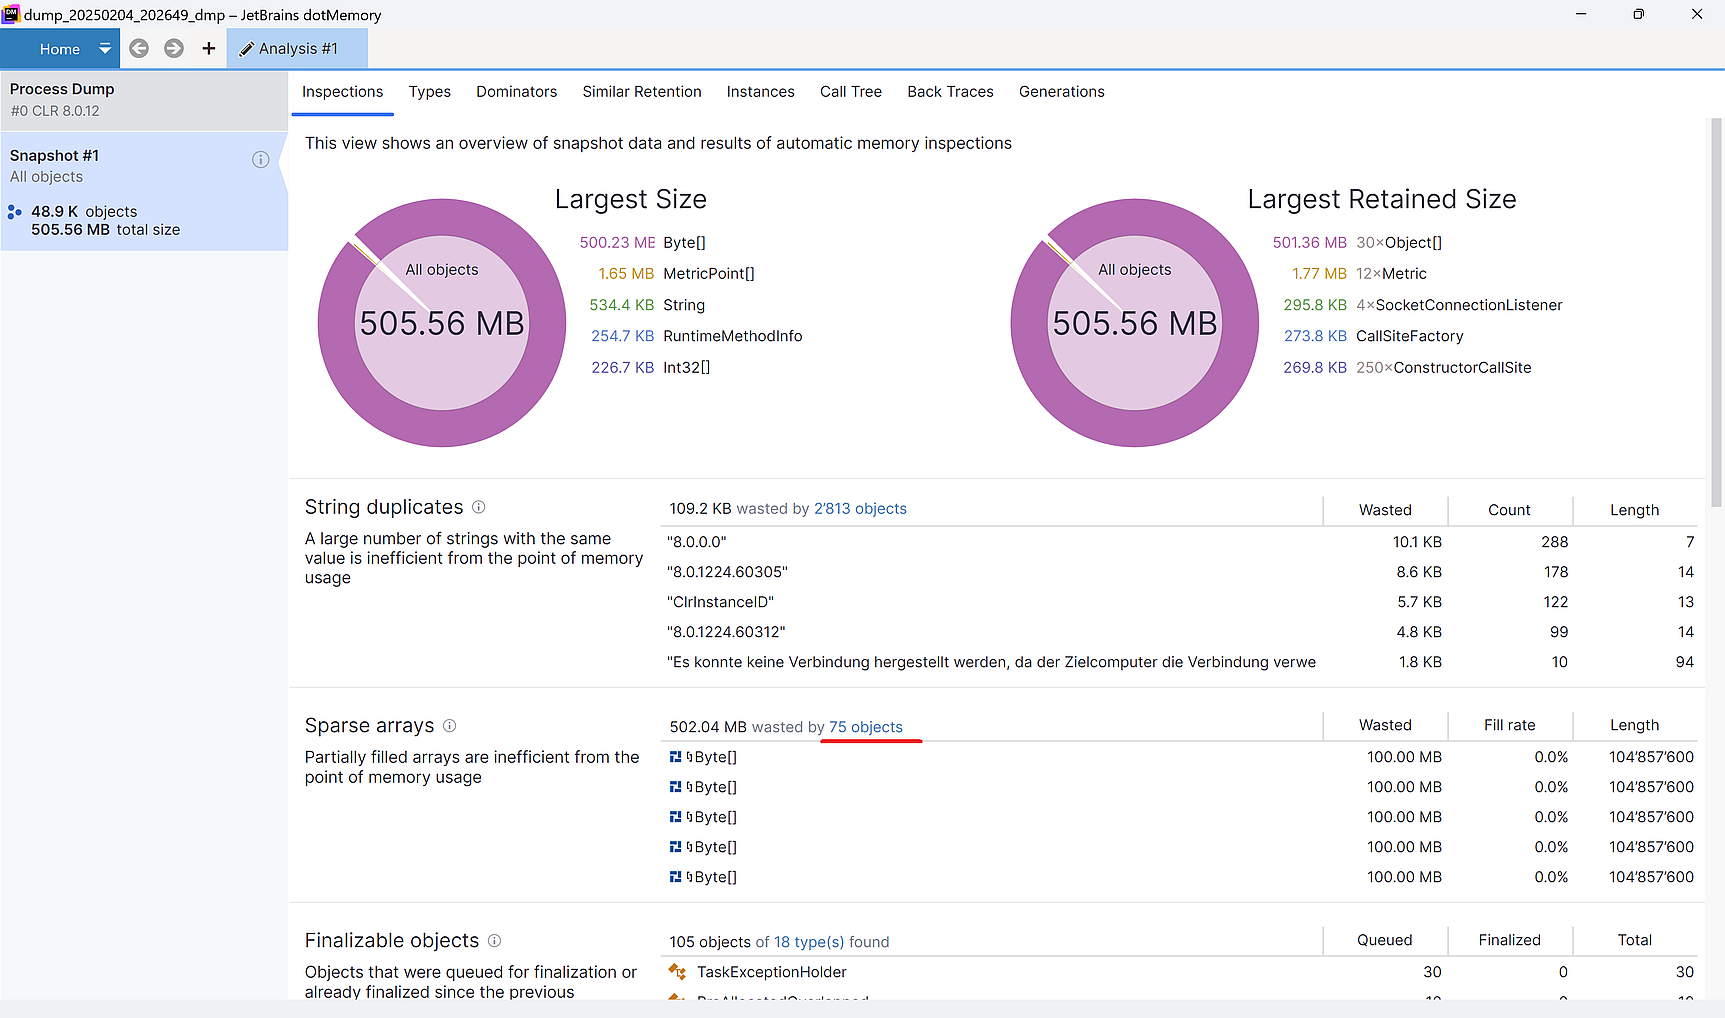
In the sparse arrays section, we see that 502MB of the total 505MB are wasted by 75 objects. That is the place where we can start to drill down. If we select the link at the 75 objects, we see the list of objects and how large they are:
![The 5 largest objects are all of type byte[] and fill 100MB each.](dotMemory_Import_Waste.png)
We notice that the 5 largest objects are 100MB each and cover 500MB of the 502MB wasted memory. That is a helpful place to be in, then of all the thousands of objects we have in our dump file, those 5 are the ones we need to inspect.
We can pick one of the 5 largest elements and drill down further:
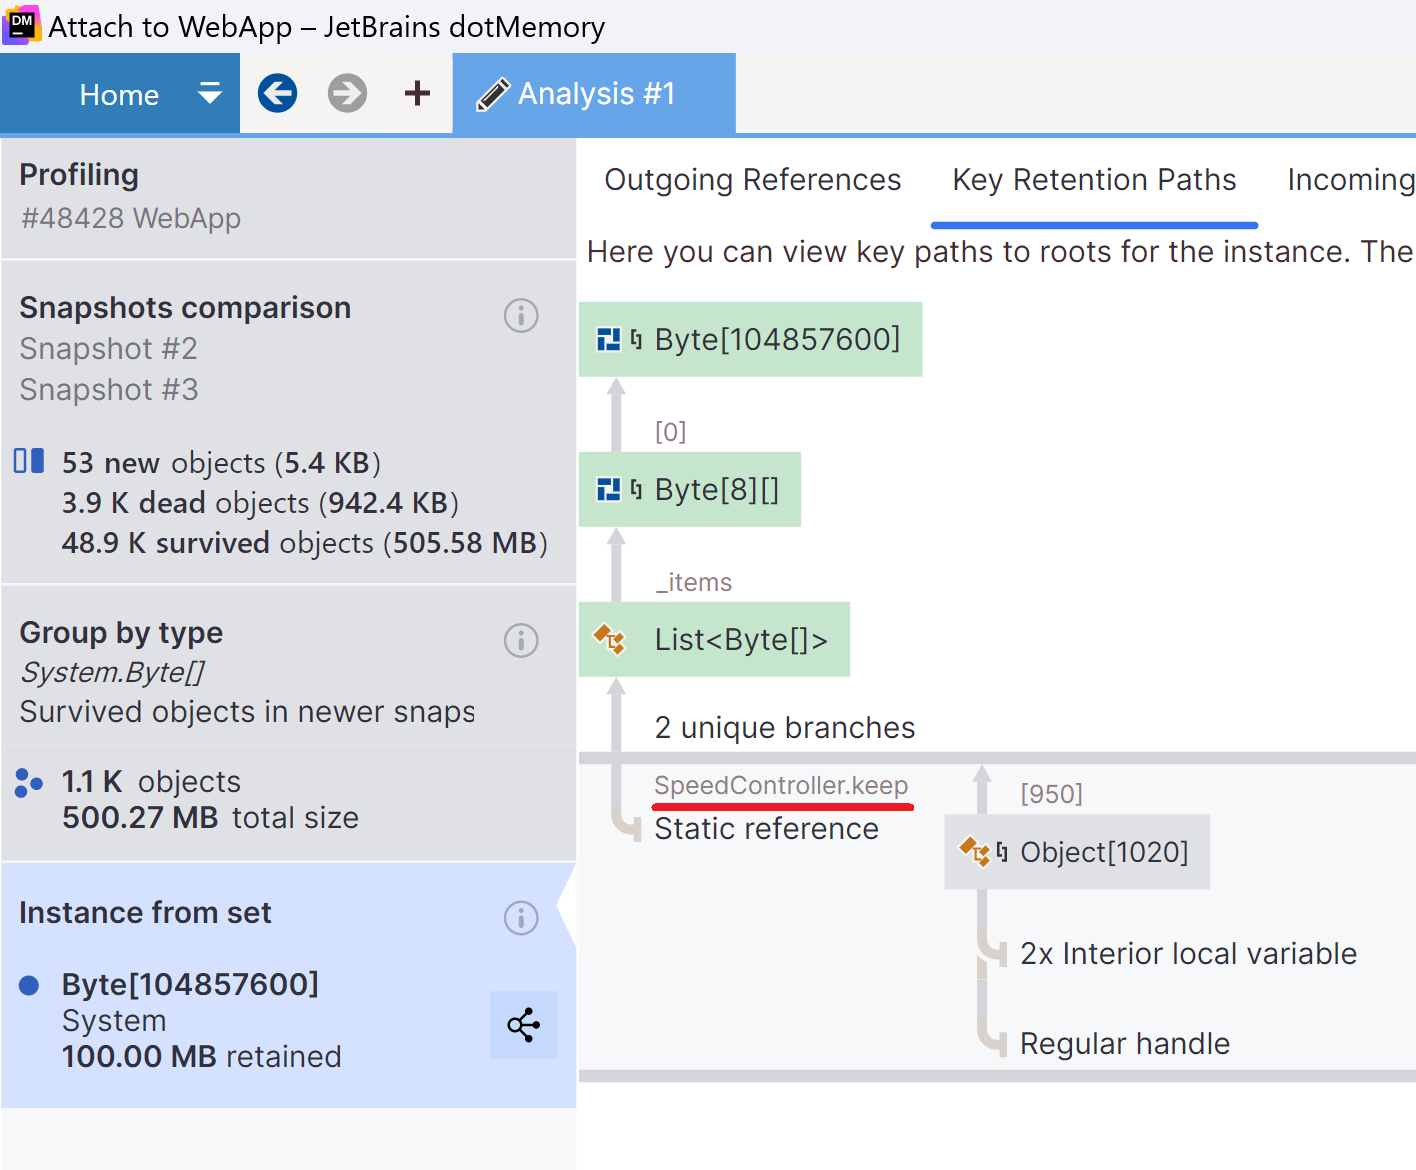
![On the tab Key Retention Paths we see that a regular handle points to the object containing byte[] via a list.](dotMemory_Import_RetentionPath.png)
On the tab Key Retention Paths we see that there is a regular handle pointing to a List<Byte[]>, but that does not help us much. It is probably a static variable that points to this list, and blocks GC from freeing up the memory.
Unfortunately, we do not get more details about the reference from our dump file. We have to dive through the code and search for a static variable of type List<Byte[]>. But there is a trick that sometimes can help us a lot.
Dump the memory with dotMemory
We can try to catch more details when we create a memory dump directly from dotMemory. Before we do that, we start the application in debug mode. With that little change, we can increase our odds to get the variable name into our dump file.
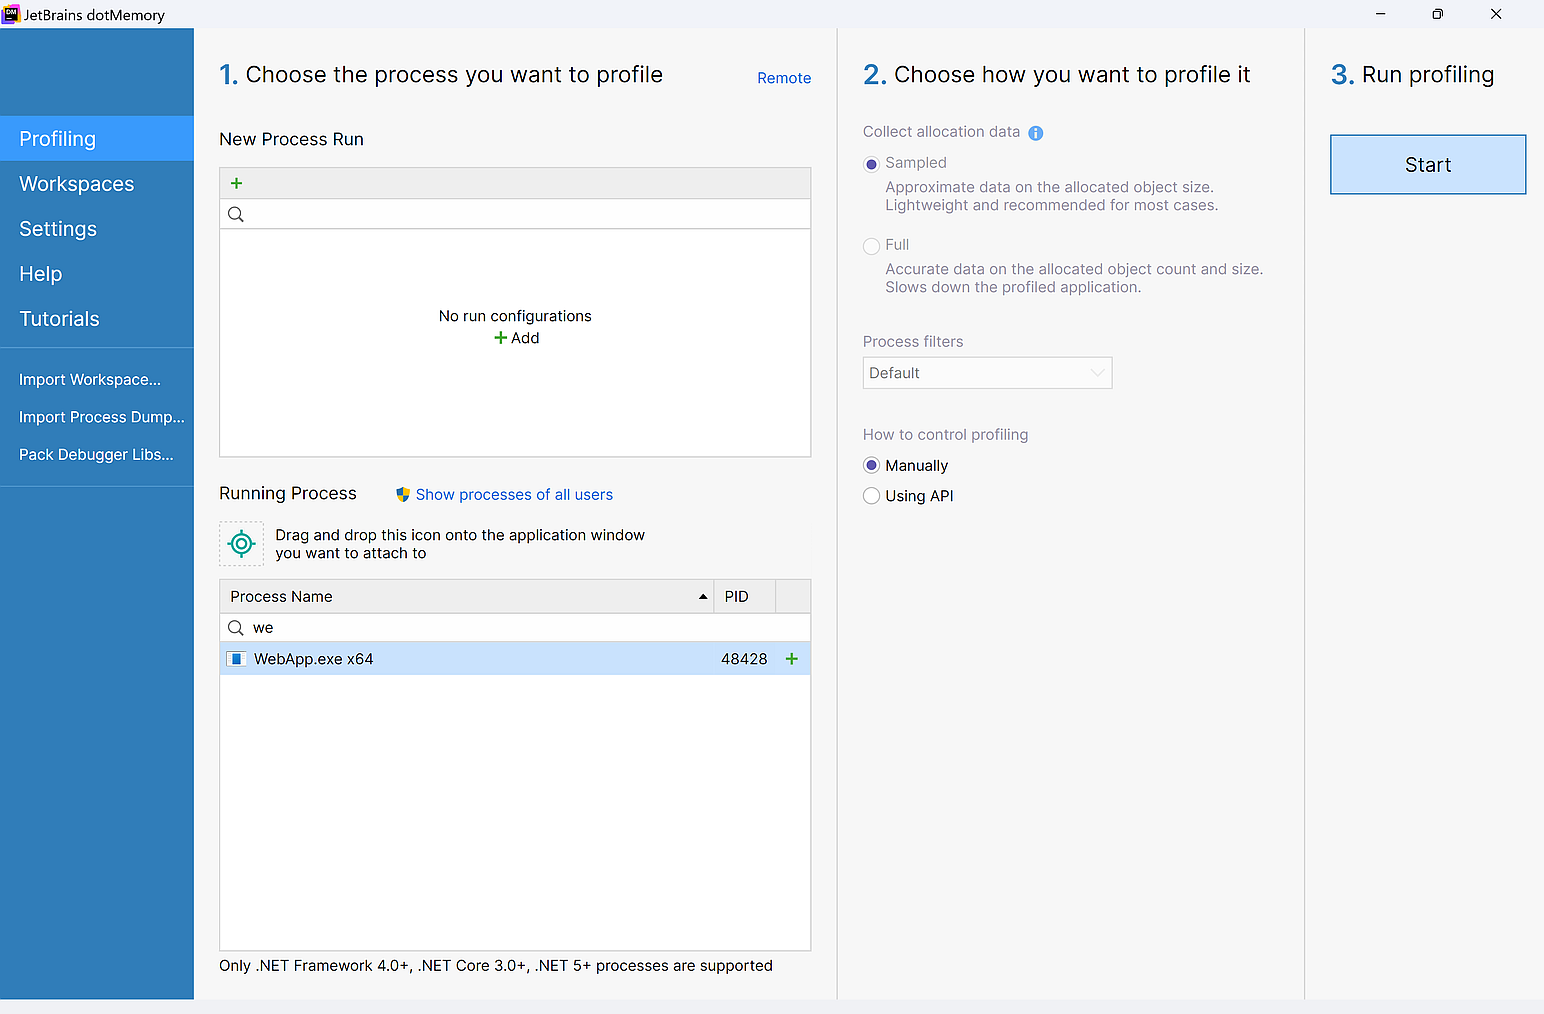
After we started the application in the debug mode, we can start dotMemory. On the start screen we search for our app in the Running Process section and select it. Do not double-click it!
When we start profiling, we see the allocated memory in real-time. We can use the Get Snapshot icon on the top to create a memory dump and the Force GC to start a garbage collector run.
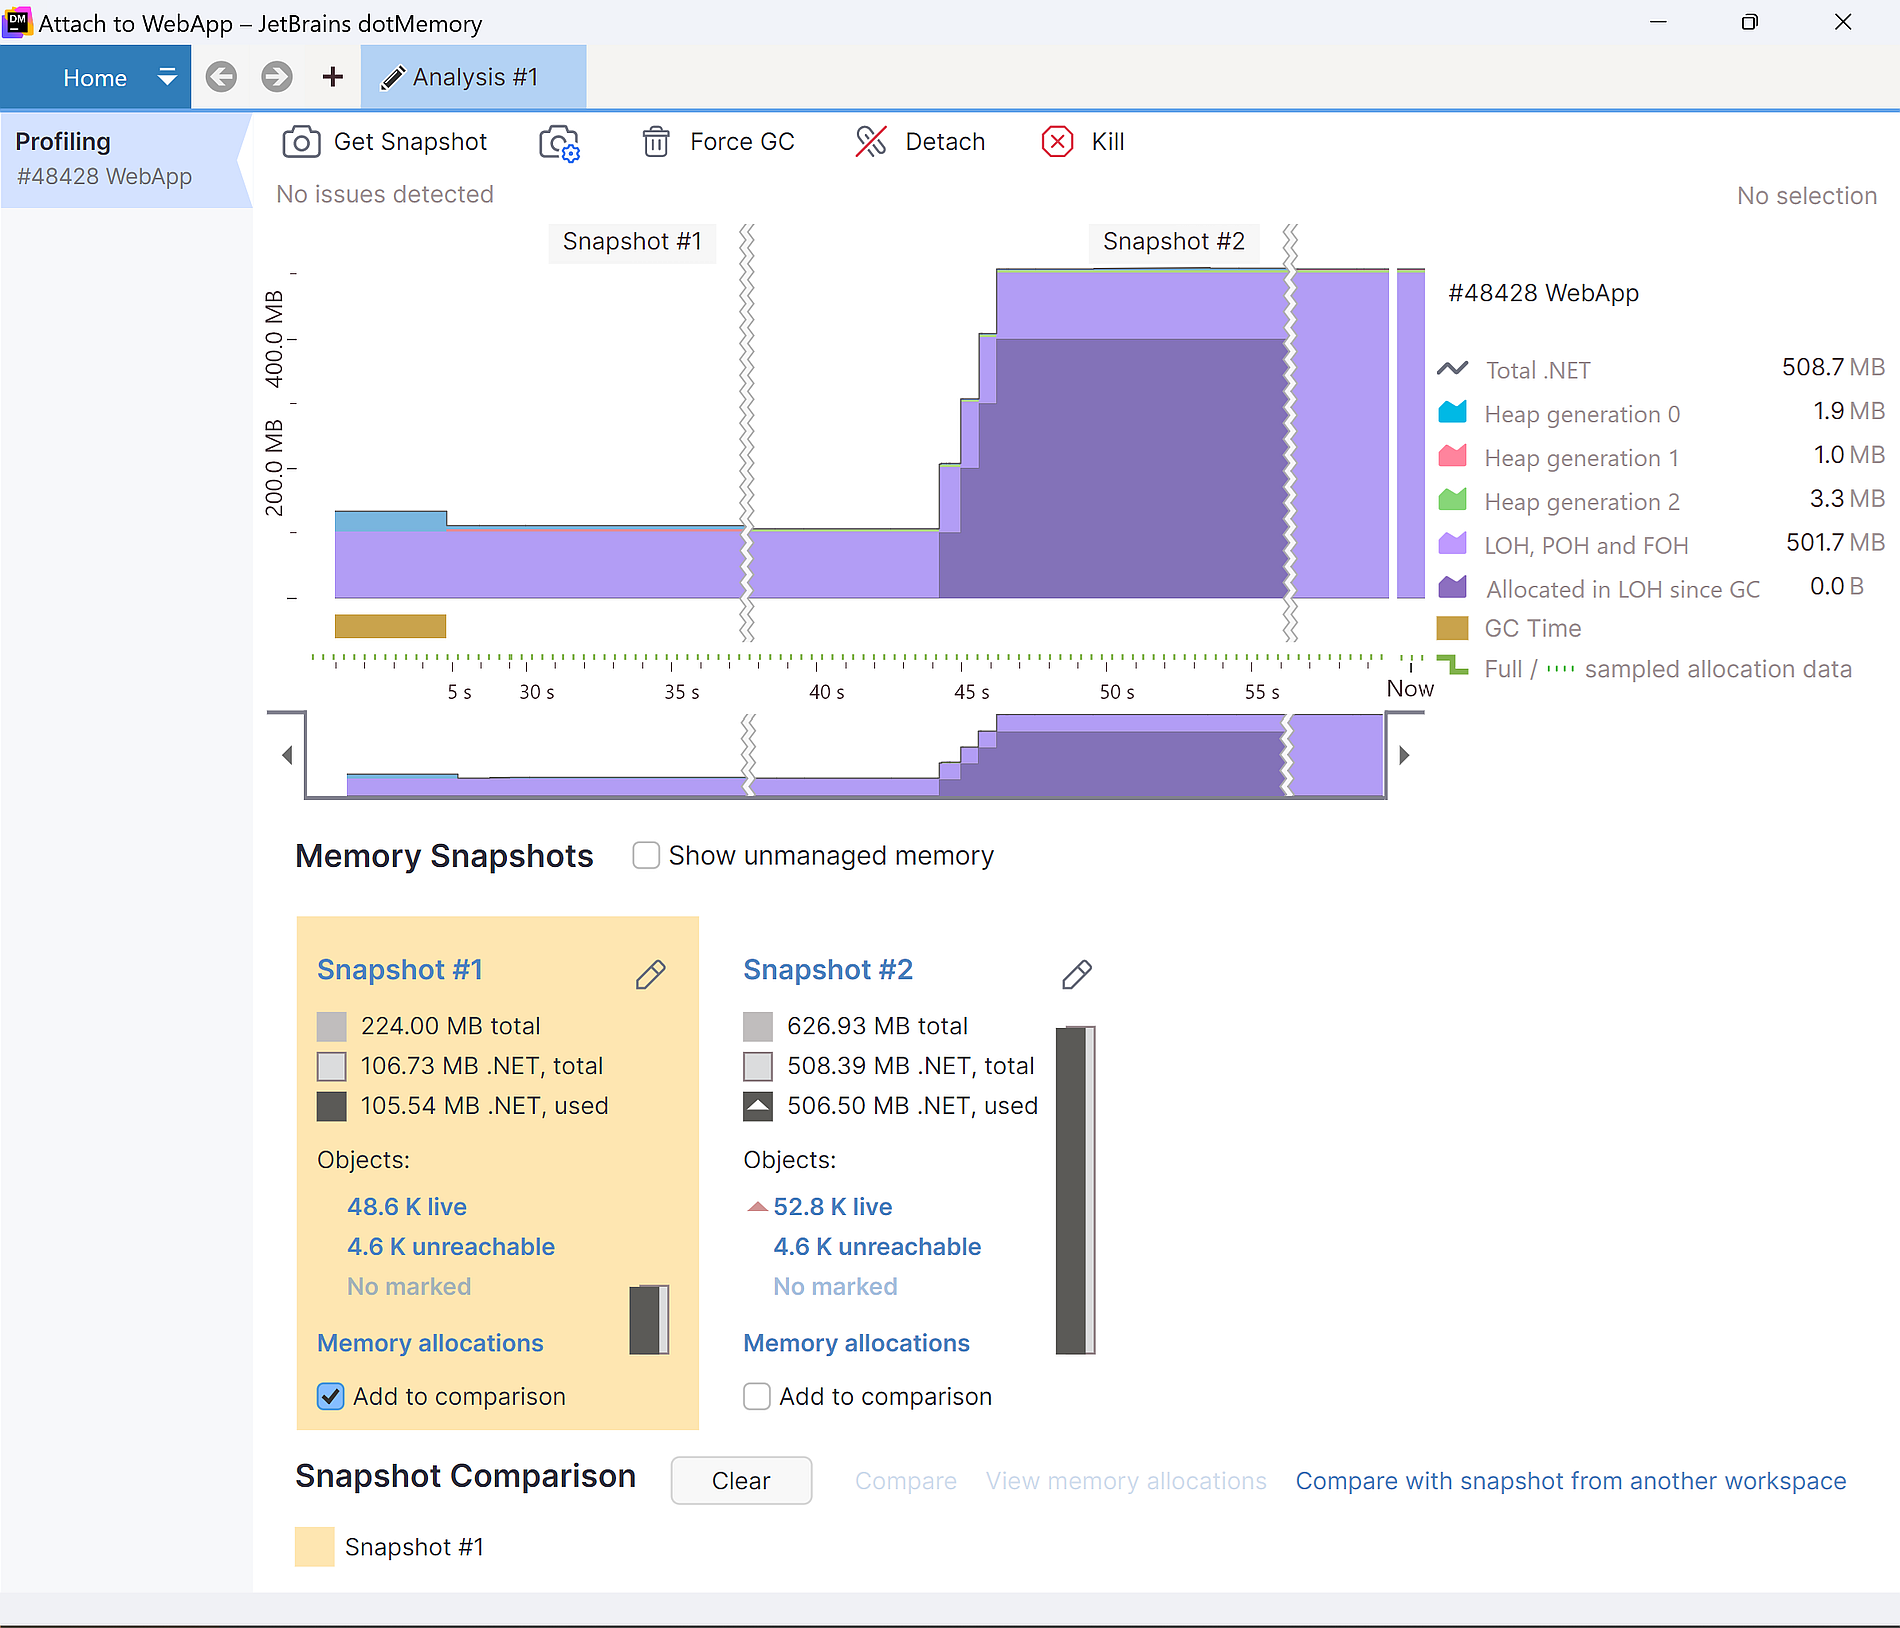
We can create multiple snapshots and then select the two we want to compare. (The compare option is the link next to the Clear button).

We now get a different screen in dotMemory, where we see the comparison of two snapshots. The main point of interest is the survived bytes. There we have again Byte[] as the larges type and it uses once more 500MB – the numbers match by accident to our previous dump file.
![The Byte[] is on the top of the survived objects](dotMemory_Dump_Survived.png)
We can now right click on the Byte[] entry to open the option survived objects in the context menu:
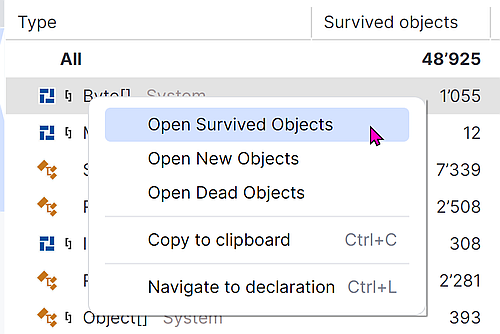
In the details view, we select one of the 5 large Byte[] entries, open it and go to the Similar Retention tab. Here we now see the class and variable name that holds the static reference and creates our memory leak:
Instead of diving through the whole application, we can now go directly to the SpeedController and search for the keep variable. As we saw in the dump file, it was indeed a static variable:
To fix the memory leak we need to rewrite the code so that it no longer needs this static variable. Maybe it was a mistake, then we can switch to readonly:
But if the static keyword was there for a valid reason, we need to put in more effort to clean up the no longer needed data.
Next
The graphical user interface of dotMemory allows us to identify memory leaks without spending hours to learn WinDbg. We can find the interesting parts much faster and save a lot of time – what probably pays for dotMemory in just one big debug session.
Next week we dive into a strange memory leak I found in a freshly migrated .Net 8 application.