Start Analysing Code with SonarQube
With SonarQube in place and the first project run through the scanner, we are now ready for the interesting part: Analysing our project.
This post is part of the SonarQube series. You can find the other parts here:
- Part 1: SonarQube: Installation Walkthrough for Windows and SQL Server Express
- Part 2: Collecting Data on your Projects with SonarQube Scanner
- Part 3: Start Analysing Code with SonarQube
- Part 4: Fine-tune the Collection of your SonarQube Projects
- Part 5: How LOC is computed in SonarQube, NDepend and Visual Studio
- Part 6: Customise the Rules in SonarQube
- Part 7: Get SonarQube Ready for Production
- Part 8: Integrate SonarQube with Visual Studio Team Services
- Part 9: Integrate SonarQube with Visual Studio using SonarLint
- Part 10: Leverage SonarQube to Fix Technical Debt in Multiple Projects
Open SonarQube on https://localhost:9000 and select your project in the Projects tab:

The first reaction of most developer is: How can my project be that bad? Don’t bother, this situation is normal. You didn’t know what rules will be checked and therefore have done nothing to comply. And please don’t jump to action right now. As we will see in a few minutes, the situation is not as bad as it may look.
In the top menu on the right side is the login form. The default user is admin with the password admin. For certain actions you must be logged in. But when you prefer to make your first steps in a way that nothing can go wrong, you can postpone the login until you can’t reach the desired action on the user interface.
This start page is a good way to work with multiple projects. But first we will concentrate on one specific project. You can open the project by clicking on its name.

The project dashboard has all the important information. You can see how big it is (top right corner), you have the bugs and vulnerabilities on the left, followed by code smells, code coverage and duplication.
The different counters are all structured in the same way. You have a list of violations directly attached to your code. If you open the bug list it will look like this:

Every violation has a title and three little … next to it. They hide the explanation of the rule and often tell you how you can fix it. You can learn a lot by reading those explanations.
Right under the title is a line with different fields. Those indicators show the category of the rule, how severe the violation is, their status and to whom they are assigned. Next to each of those indicators is a little drop-down icon, that you can expand (when you are logged in):
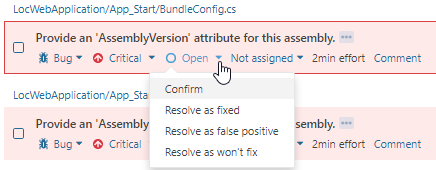
Another important part is the calculated duration to get rid of that problem. I find those calculations interesting, but often far away from reality. Therefore, look at them but don’t be scared. While the numbers may be off for a single item, they aren’t that bad for the overall effort. The items with too much expected effort compensate those with too little.
You know now the most important parts and can explore the reported problems of your project on your own. If you scroll through them, you will notice some strange errors. Files that should not be analysed are in, others that are important are missing and some rules don’t seem to make any sense at all. I will explain in the next few posts how you can fix those errors.
Next
Before we start modifying rules we should make sure that we have the right files selected. In the next post we go back to the scanner and exclude some paths.