How LOC is computed in SonarQube, NDepend and Visual Studio
Lines of Code (short LOC) are an often used metric to compare projects by their size. All you need to do is to count the lines of source code to figure out if project A is bigger than project B. However, that is only true when they use the same programming language. Only then can you do the same work in a line of code. If you compare Ruby with C or Assembler your LOC metric may differ by many orders of magnitude to get the same things done.
If you used the last post to fine-tune the exclusion settings, you may still have a huge gap between the LOC reported by SonarQube and Visual Studio. As it turns out, different tools use different ways to calculate LOC. Let’s look how many different approaches exist to do something simple like counting lines.
This post is part of the SonarQube series. You can find the other parts here:
- Part 1: SonarQube: Installation Walkthrough for Windows and SQL Server Express
- Part 2: Collecting Data on your Projects with SonarQube Scanner
- Part 3: Start Analysing Code with SonarQube
- Part 4: Fine-tune the Collection of your SonarQube Projects
- Part 5: How LOC is computed in SonarQube, NDepend and Visual Studio
- Part 6: Customise the Rules in SonarQube
- Part 7: Get SonarQube Ready for Production
- Part 8: Integrate SonarQube with Visual Studio Team Services
- Part 9: Integrate SonarQube with Visual Studio using SonarLint
- Part 10: Leverage SonarQube to Fix Technical Debt in Multiple Projects
Where is the LOC metric?
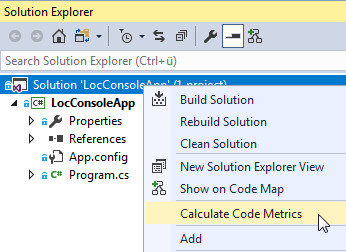
SonarQube and NDepend will show you the LOC right on their project screen. As soon as you analysed your project you can see this metric. Visual Studio is a bit different: the context menu in the Solution Explorer (reachable with a right click on your solution) has an entry called “Calculate Code Metrics”:
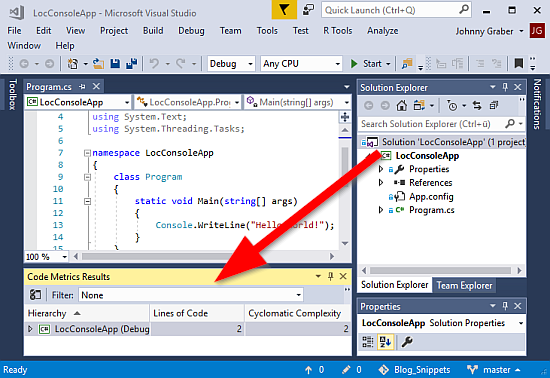
Depending on the size of the project, it may take a few seconds to a few minutes until the result is displayed under your code:
Big differences
I created a project with the ASP.Net project template and analysed it in NDepend, SonarQube and Visual Studio. The result shows a rather big difference in calculated lines of code:
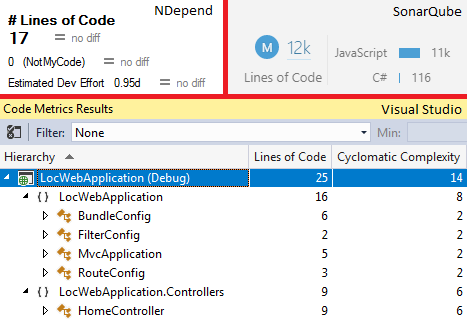
NDepend calculated 17 lines, Visual Studio 25 and SonarQube 12’000. Most of the lines in the SonarQube metric are JavaScript, but even when we ignore them, we are left with 116 lines of C# code. That is 4 to 6 times the LOC of the other tools.
To get a plain field for the comparison I created another project with the command line tool template. This one has only C# code but the LoC metric shows again a big difference:

NDepend reports 1 line, Visual Studio 2 and SonarQube finds 15 lines. The gap is now even bigger and the opposite of what I expected. The first reaction of this second graphic should be to check if you compare the same things. Are the same files considered? Or are some folders present that should be excluded in SonarQube? I checked again and again but found no errors. If you look at the single C# file and count the lines yourself, you can spot how SonarQube got its result:
The file has 16 lines with one empty line. If we ignore the empty line, we end up with the 15 lines that are reported by SonarQube. But how do NDepend and Visual Studio calculate the LOC metric?
Visual Studio: IL Code
Visual Studio uses the IL code to calculate the LOC metric. The Intermediate language (IL) is the machine-independent output of the .Net compiler. That is a good choice to compare the different languages of the .Net platform (C# and VB.Net), since the IL is for all those languages the same and has removed the differences in the syntax. However, that also means you won’t get a precise number for the LOC metric.
NDepend: logical LOC
NDepend uses logical lines of code. They are calculated based on the sequence points in the PDB files. A sequence point is used to mark a spot in the IL code that corresponds to a specific location in the original source (see Rick Byers blog post for more details). Using logical lines of code instead of the physical lines you write means that the coding style doesn’t influence the LOC metric.
SonarQube: physical lines
SonarQube uses the physical lines of code to calculate the LOC metric. Every line that has at least one character (which is neither a whitespace nor a tabulation nor part of a comment) is counted. This works with every language and doesn’t need any compiled code. However, the physical lines include the using statements and the namespace definition. And when you follow the default settings in Visual Studio, your { } go on a separate line which adds 2 lines for every code block. Those rules are the reason why the LOC of SonarQube is so much higher than the values in Visual Studio and NDepend.
Conclusion
A simple metric like LOC has a lot to consider. Depending on what you calculate your result may vary significantly. Before you compare apples to oranges you should make sure that you use the same definition and ideally the same tool to calculate this metric.
Why do they use so different approaches? The links above point you to the documentation of the 3 tools I compared. Each offers good arguments for their approach and shortcomings in the others. Depending on your constraints and unwanted side effects, you can choose an approach that fits your need. And if you don’t know what to choose, pick the tool you like the most and stick to that approach.
Next
Since we now can explain the difference in our project size it's time to make sure that the rules we check in SonarQube are the right ones.