Close the Loop and Load Test the Improvements
Last week we used BenchmarkDotNet to compare our improved method against the original one. Since it was faster, we changed the application to use the new code. The final part to close the loop, as my friend Daniel Marbach says, is now to measure the whole application once more to make sure that we indeed get a performance boost.
Rerun the performance tests
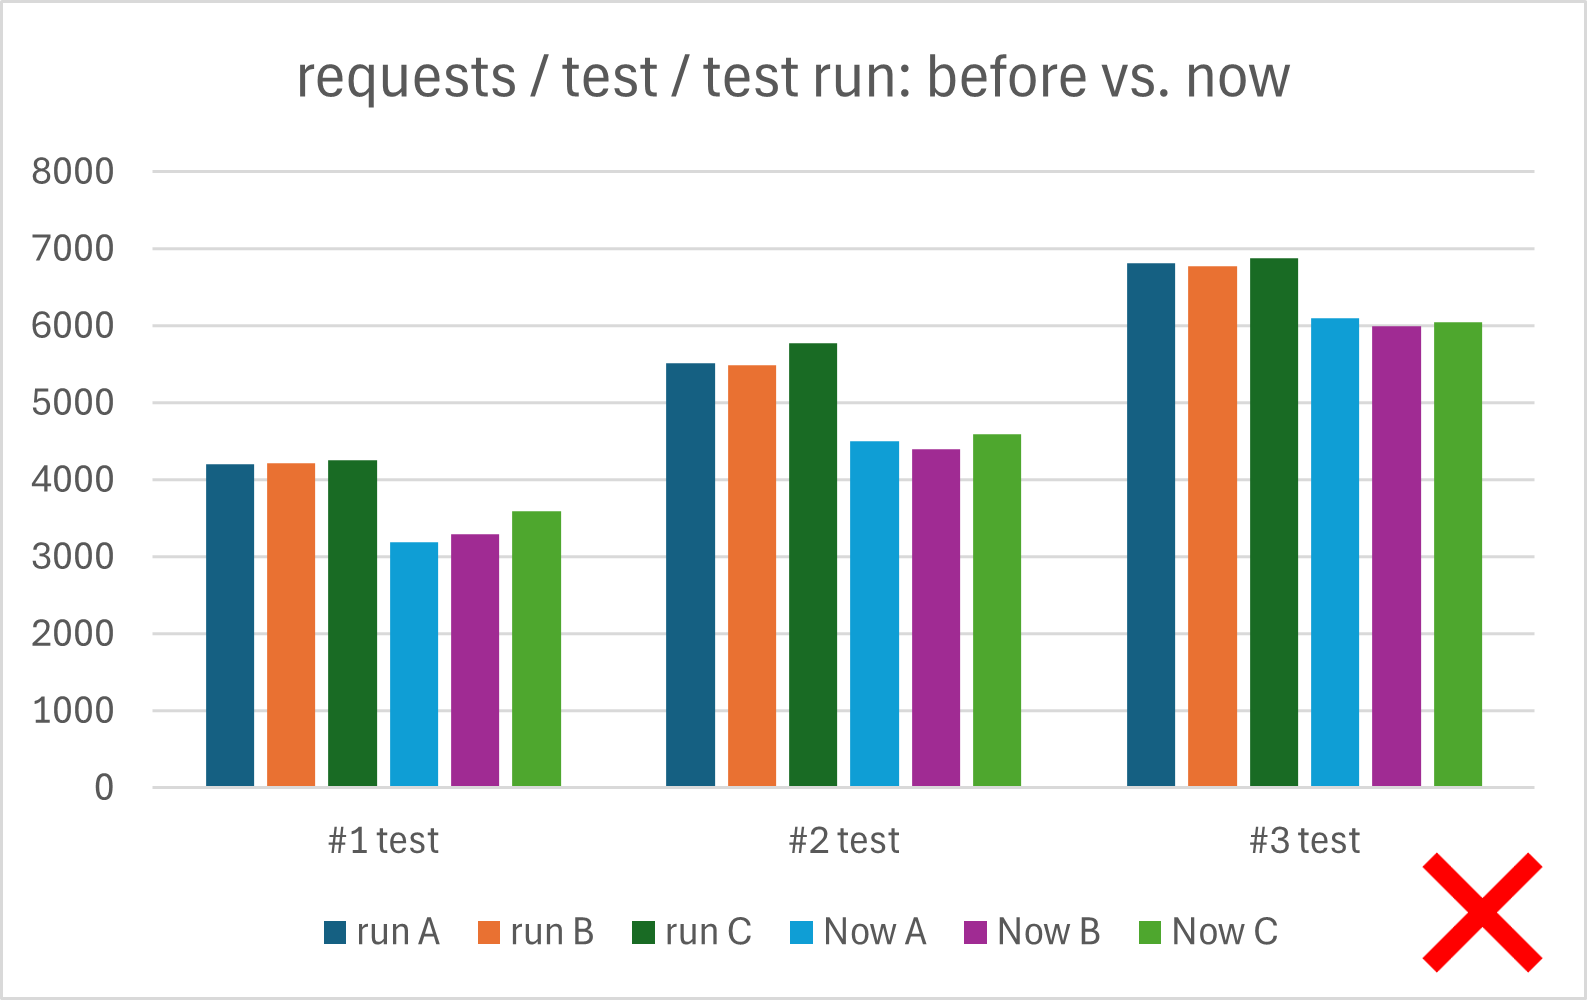
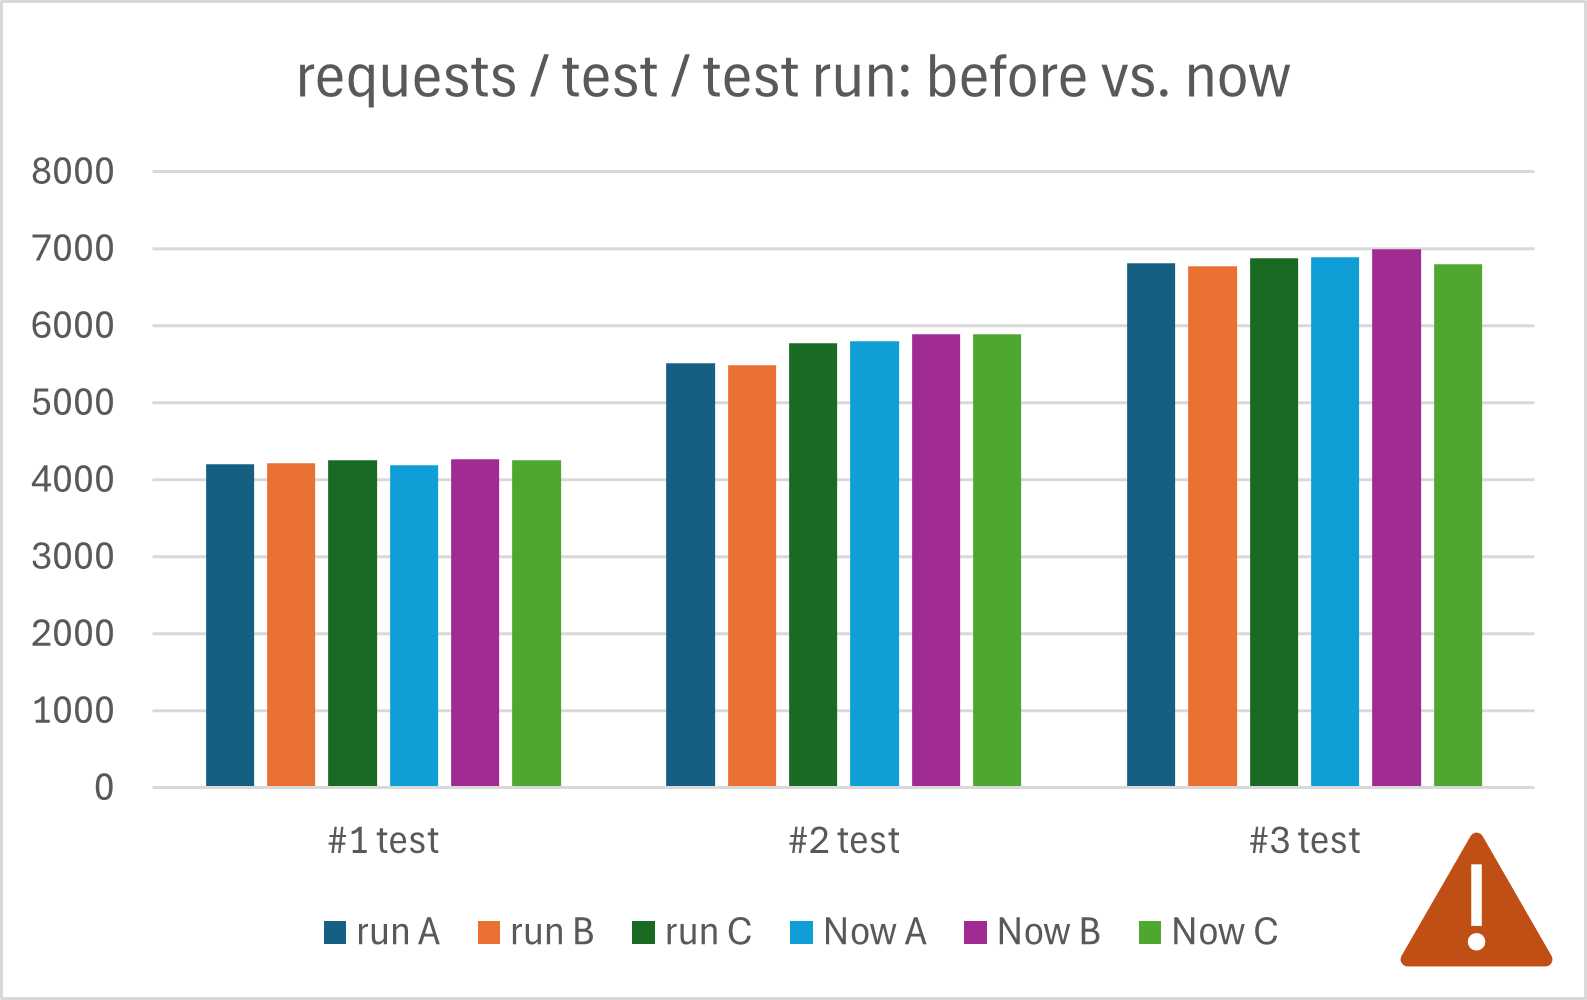
Before we found our slow method, we did performance tests to find the bottleneck. It is now time to get out the documentation of these tests so that we can repeat them.
With our notes we should find the machines we run the test the last time and put it into the same state as we had the first time – or at least as near as possible. We use the same tool with the same parameters to run the performance tests. Now is not the time to get creative and find new things; we want to redo the tests as close as possible.
Write down the results the same way as in the first round. That way we can compare them more easily.
Compare the results
When we compare the results, we should see one of 3 possible outcomes:
- The application now runs faster.
- There is no measurable difference.
- The application now runs slower.
If our application is now faster, we did a good job and improved the performance. If we see no downsides with our code improvement, we keep it in place and go to the next task.

If our code runs slower, we should revert the change and start from scratch with another round. It could be that our fix has unintended side effects that negatively impact the performance of the application. Or we made a mistake that only shows up when we run the whole application. Whatever it is, we are worse off than we were at the beginning. Let us not waste more time and cut our losses.
If we have an application that runs equally fast, we are in a hard spot. Should we continue or should we abort? We may just find the next bottleneck that is only slightly bigger than the one we have just resolved. Or we may be on a detour that will not result in any noteworthy improvements at all. We do not know and need more time to figure it out. In this situation I suggest you check the time box you set yourself for this task. Do you have time left? If so, use it. Otherwise, add another (smaller) time box to check if you can find the next bottleneck.
Verify in production
If we could measure the performance improvement of our fix, we can go on to the last step and put it into production. There we have real users doing real work. Hopefully, we also have enough instrumentation in our application to measure the impact of our change.
The measurements we can make on the production will help us in two ways. The first and obvious one is that we need to know how much this change impacts the runtime of the whole system. Was it significant? If so, we may get more time to spend on other improvements. Was it not so significant? Then we learned something about our application and can use it for the next performance problem we want to address.
The second point we can learn is to what extent our locally measured improvements are comparable with those observed in the production system. Initially, we expected that they would align. With more data, we gain a more detailed understanding about the scaling factor between local improvements and those in production. This in turn can help us with future performance improvements (e.g. to justify spending an extra hour on the performance task).
Next
The performance improvement loop is now at an end. We learned how to create load on our application, how to measure where in the application we spend the most time and how to make sure that our fixes are indeed a performance improvement.
Next week we start another loop, this time to track down memory leaks. And the best of it? We can reuse a lot of the tools we used for the performance loop.