Monitor your Applications with Kibana
Kibana is the powerful search interface of Elasticsearch. Depending on how many log messages you need to store you can run both tools locally or in the cloud. Today you will learn how you can install Kibana and what possibilities it has to monitor your applications.
This post is part of the Improve Your Log Messages series. You can find the other parts here:
- Part 1: The Missed Opportunities of Log Files
- Part 2: Structured Logging with Serilog
- Part 3: RavenDB as a Sink for Serilog
- Part 4: Seq as a Sink for Serilog
- Part 5: How to Influence the Output of Serilog
- Part 6: Monitor your Application with Seq
- Part 7: Debugging With Serilog
- Part 8: Elasticsearch as a Sink for Serilog
- Part 9: Monitor your Applications with Kibana
- Part 10: Closing the Feedback Loop from Log Messages to Knowledge
- Part 11: How To Analyse IIS Log Files
- Part 12: Using Logstash to Analyse IIS Log Files with Kibana
- Part 13: Analysing Apache Log Files with Logstash and Kibana
- Part 14: How to Analyse SharePoint Log Files
Download & Installation
You can get the latest Kibana version from Elasticsearch.org as a *.zip file. To install it you simply unzip the downloaded file in the root folder of your default web site on IIS. Should you not already have such a site you can quickly add one using the IIS Manager.
IIS Configuration
The first time you run Kibana on IIS you may only see an error message. Unfortunately the default configuration of IIS can’t handle JSON as a MIME type. To fix that you simply open the IIS Manager and add two additional MIME types with these values:
| File name extension | MIME type |
|---|---|
. |
application/octet-stream |
.json |
text/html |
Don’t forget to restart your IIS after you added those two types.
Start with the Logstash Template
When you visit your freshly installed Kibana at 127.0.0.1:9200 you will see a screen like this one with a quick introduction:
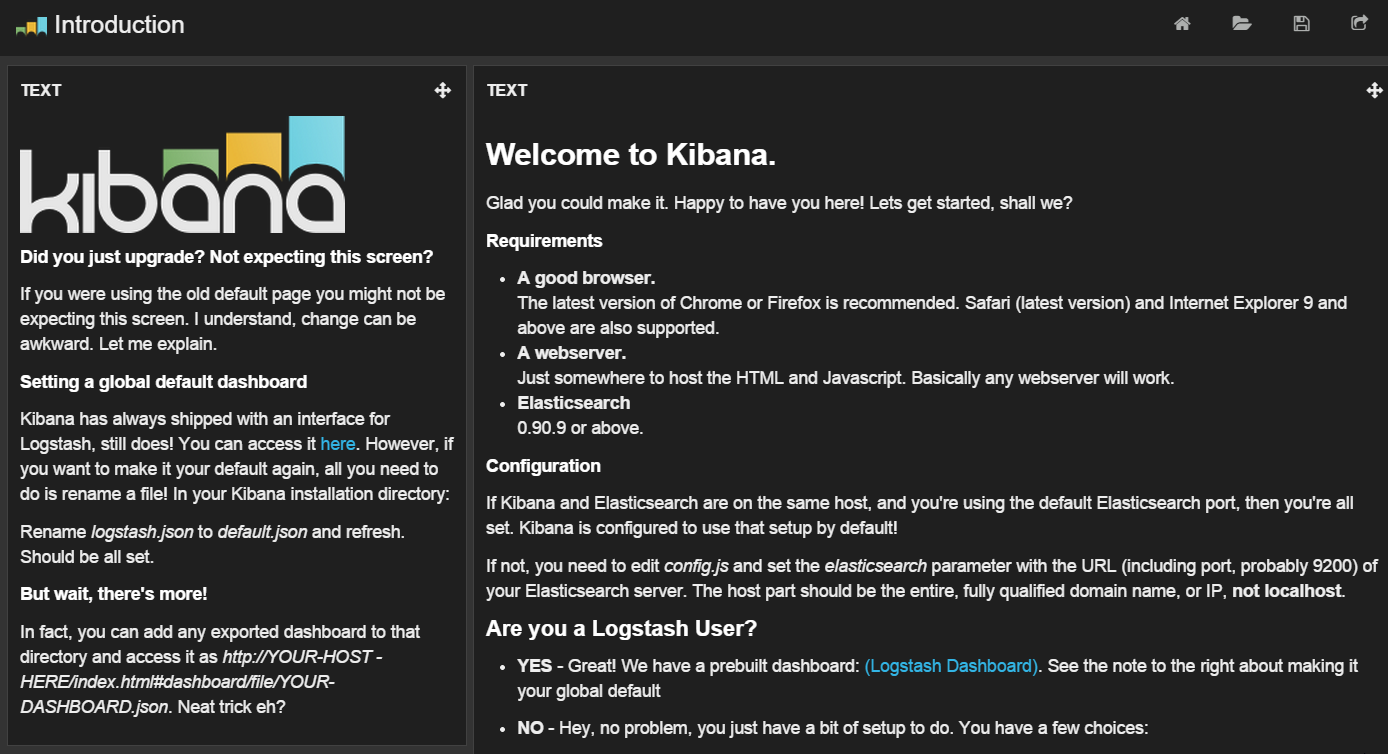
The most important part of this screen is the selection of your dashboard. You can start with an empty one and fully configure it to your needs. However, I suggest that you don’t start from scratch and instead go with the one for Logstash. This dashboard has a basic set of controls ready to go and you can fine-tune it later should the need arise. You find the link in the lower half of the description:

As with all the other dashboards they start out empty. But as soon as you have some events in Elasticsearch your dashboard can look like this one: 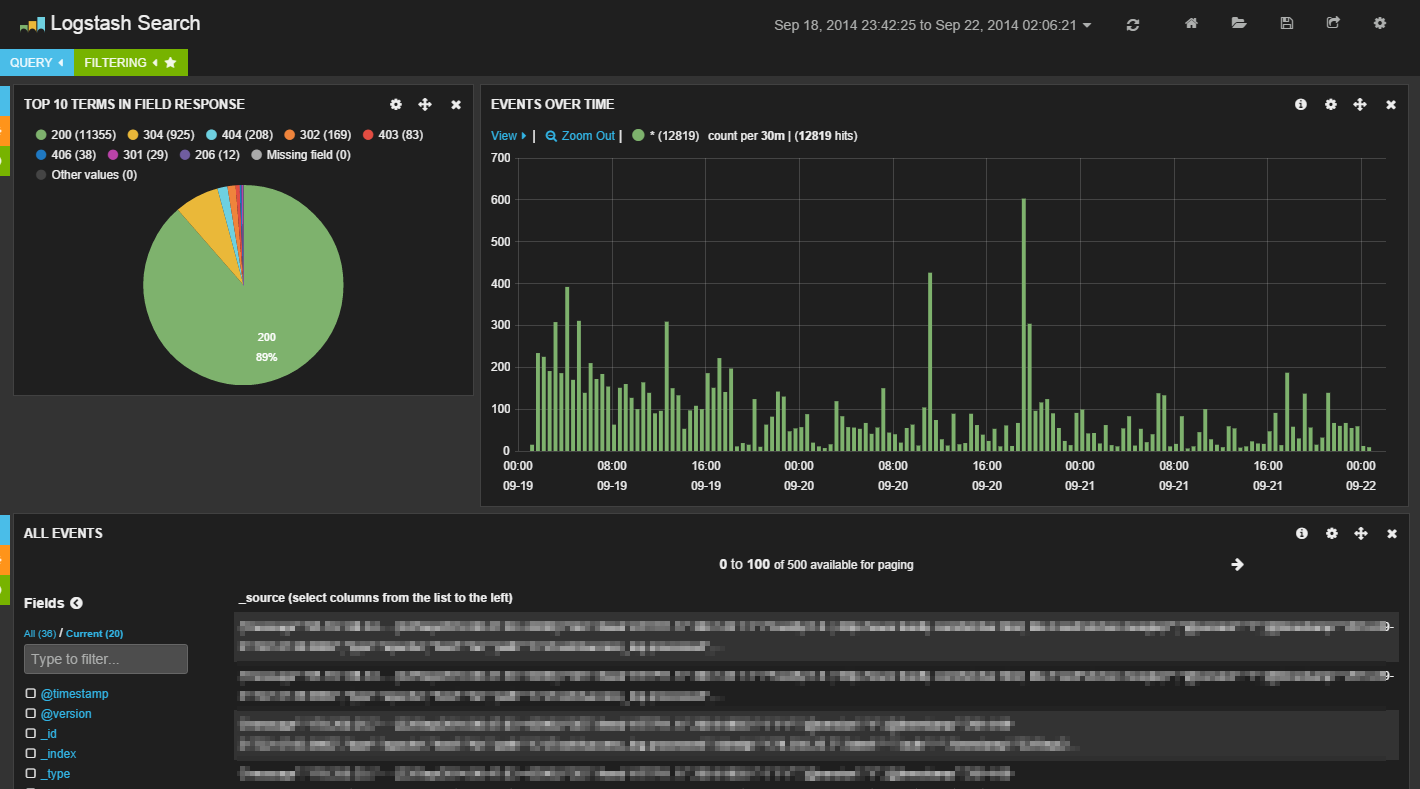
Query your Events
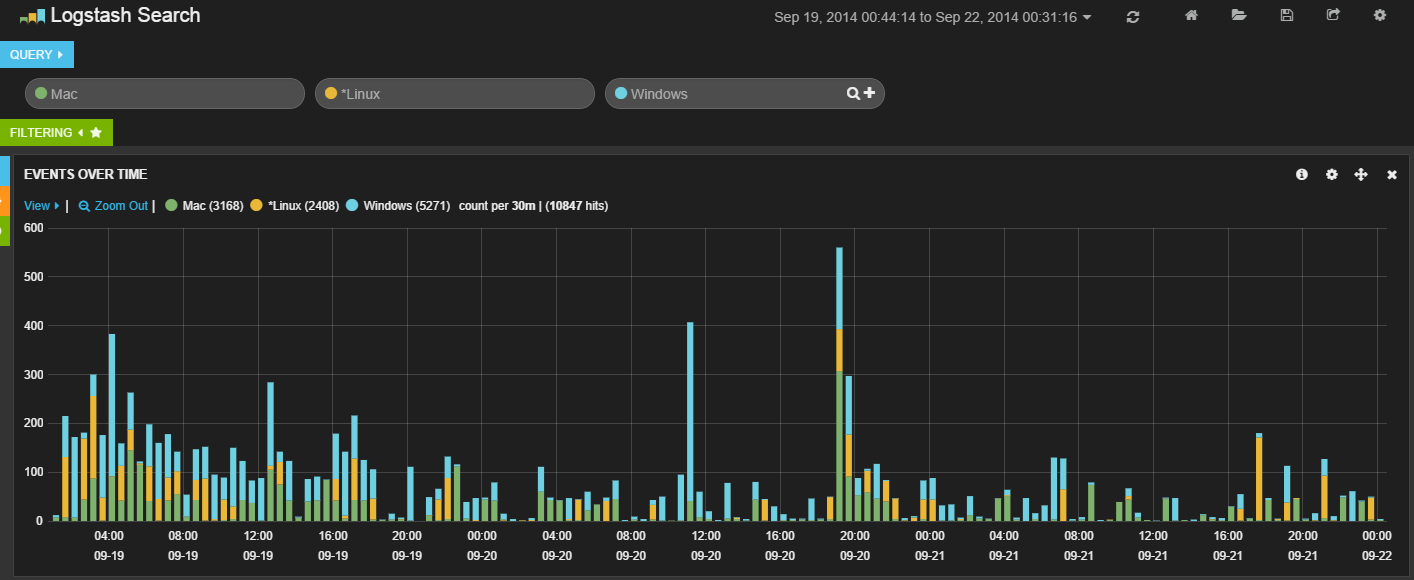
One great thing in Kibana is the flexibility you have when querying your events. The top row in the interface allows you to search for words and Kibana associates automatically different colours to them. In the timeline the same colours are reused to show you instantly which events match which query terms:
Drill Down
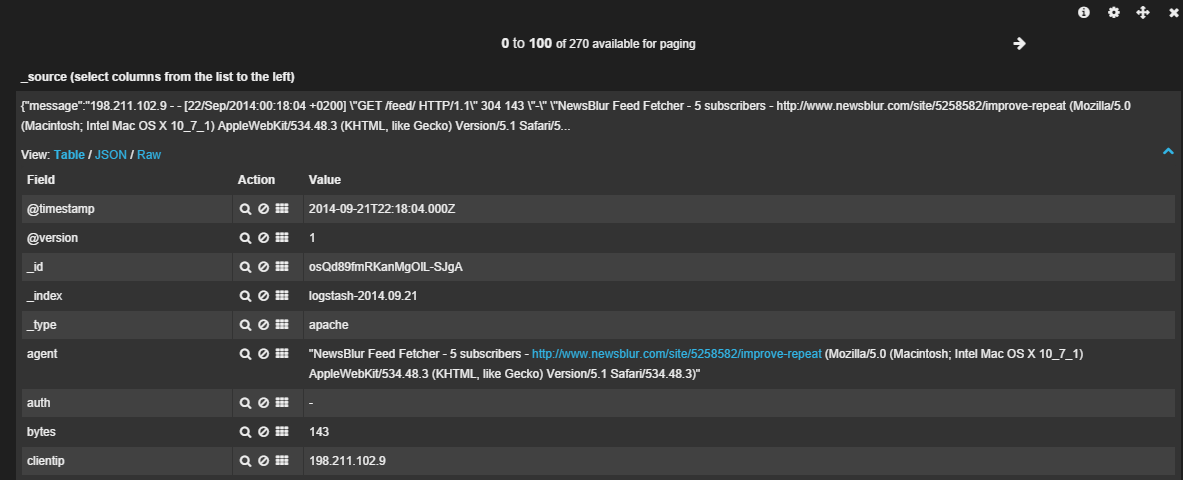
On the bottom left corner you find all the fields that exist on events for the selected time range. When your events are form a web server you find there all the information on the browser, the requested paths or the response codes. When you click on a field you can instantly see the top values and a graphical representation of their distribution:
This is nice to get an overview, but usually you want to know more. To see which events relate to the field value you can click on the magnifying glass. The overview fades away and gives the space to the list of events. From there you can click on a single event and see all the other stored fields:
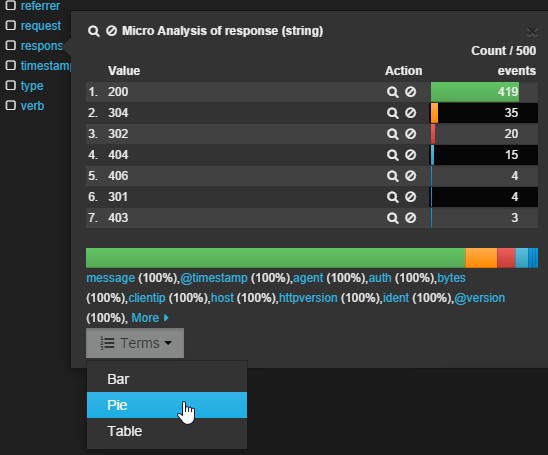
Pie Charts
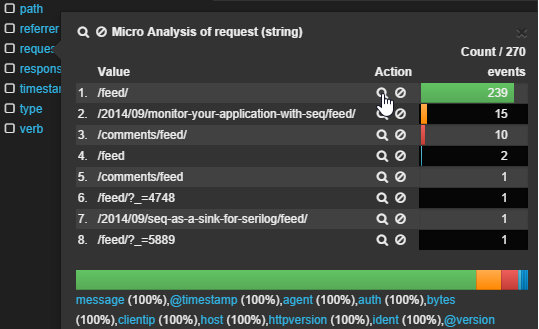
The list of hundreds of events is nice when you are interested in such a deep level of details. But most often all you need is an overview that is better explained using a pie or a bar chart. You find them in the drop-down list of the Terms button:
The chart is not just an image. When you want to know more about a value you can drill down by clicking on the corresponding segment. Depending on the data structure behind the chart it will either go down to the next level or show you all the matching events as a list.
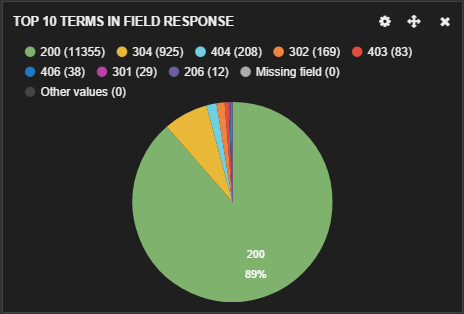
If you like those charts then you can drag & drop them to a more suitable place in your dashboard.
More on Kibana & Elasticsearch
If you want to know more on Kibana and Elasticsearch I can recommend these resources:
- Elasticsearch - The Definitive Guide
- Kibana: 10 minute walk through
- Server fault (the Stack Overflow for system administrators) offers many questions and answers on Kibana, Logstash and Elasticsearch.
Next
By now we know how to create meaningful log messages (using Serilog) and monitor our applications with Seq or Kibana. Next week we will look at the possibilities we gain by using this infrastructure in combination with an agile style of software development.