Using Logstash to Analyse IIS Log Files with Kibana
The IIS log files collect all the actions that occur on the web server. As explained last week you can use Log Parser to filter the events. However, when you use Kibana for all your applications then you would prefer to have the IIS log events there as well. Today I will explain how you can use logstash to read the log files from IIS and store the events in Elasticsearch.
With logstash you can parse log files, extract the events and store them in any format that helps you to work with those events. If you don’t like Elasticsearch you can easily switch to another output format and write the events to Redis, MongoDB or send them away in an e-mail. The documentation explains in great detail all the possibilities and options you have. If you run into any kind of trouble you definitely should go there and read this carefully prepared documentation.
This post is part of the Improve Your Log Messages series. You can find the other parts here:
- Part 1: The Missed Opportunities of Log Files
- Part 2: Structured Logging with Serilog
- Part 3: RavenDB as a Sink for Serilog
- Part 4: Seq as a Sink for Serilog
- Part 5: How to Influence the Output of Serilog
- Part 6: Monitor your Application with Seq
- Part 7: Debugging With Serilog
- Part 8: Elasticsearch as a Sink for Serilog
- Part 9: Monitor your Applications with Kibana
- Part 10: Closing the Feedback Loop from Log Messages to Knowledge
- Part 11: How To Analyse IIS Log Files
- Part 12: Using Logstash to Analyse IIS Log Files with Kibana
- Part 13: Analysing Apache Log Files with Logstash and Kibana
- Part 14: How to Analyse SharePoint Log Files
Installation
All you need to do to install logstash is to download and extract the *.zip file form the official web page. Logstash is using the JVM and needs like Elasticsearch a Java runtime and the JAVA_HOME environment variable.
If you get an error message about too long lines or reaching a max request size when you use logstash with Elasticsearch then you should try to install Ruby (with the RubyInstaller) and JRuby. That solved those problems for me on two different machines.
A Simple Configuration
Before you try to connect logstash with the IIS logs and Elasticsearch you should check that logstash works as expected. Create a simple configuration file with this content:
Logstash follows the idea of an ETL-Tool (Extract, Transform, Load) and needs an input, an output and if you like a filter to transform the data. This example reads from standard input and writes to standard output using the rubydebug codec. To run this file you open the command line tool of your choosing, got to the bin folder of the extracted logstash files and run the agent with this command:
Attention (update on 6.4.2016): Recent versions switched this behavior and now only work with \ (backslash) in the path on Windows.
Logstash is waiting on an input and when you enter “hello” and hit enter you should get an output like this one:
A Configuration for IIS
The configuration to read from IIS log files and write them to Elasticsearch is a bit more complex. To read the files we need a file adapter where we have to specify which files should be read. For the output we need to declare where our Elasticsearch server is and which protocol we want to use. The main activity however is in the filter command. Using grok we can split a text into different parts. The syntax is a bit special but it’s not that hard to understand it. The other parts are a nice addition to set the correct time zone and manipulate the fields for the user agent.
IIS let you configure how the log files should be written. If you modify the fields or change the order you need to change the fields in the grok section as well.
To read the log files you go back to the command line and run this command:
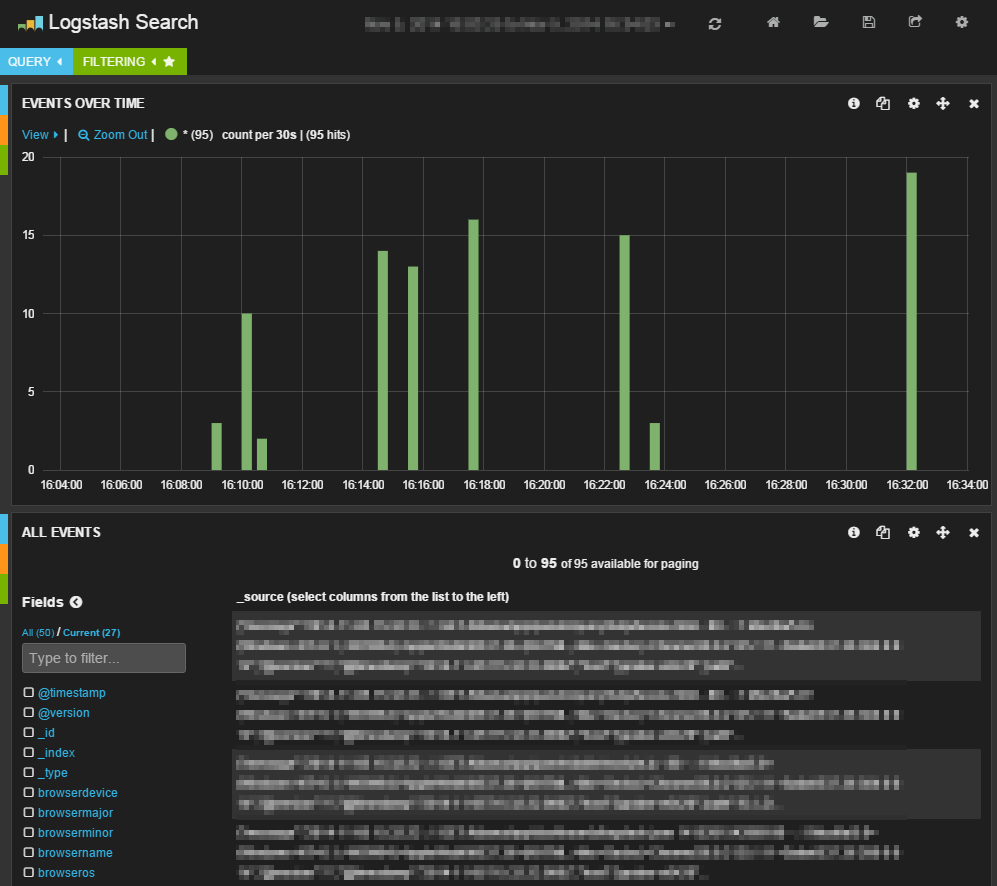
If all is correctly configured you will see what events are detected (thanks to the stdout part in the output) and send to Elasticsearch. If you open the Kibana interface you should see your log messages:
Grok Debugger
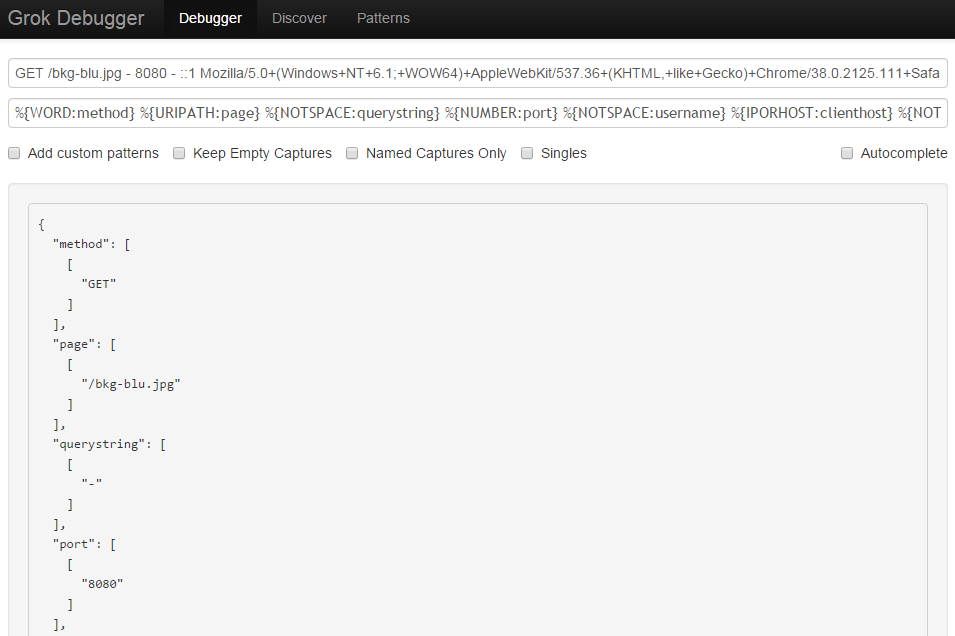
If you run in any kind of trouble with grok then you should use the Grok Debugger. On this page you can add a typical log message and your grok pattern to see what is detected. It doesn’t show where exactly the error is but you can figure that out by deleting tokens from the end. As soon as you no longer have an error in your pattern the message is parsed and you can look at the resulting structure:
Next
A big configuration file like the one for IIS with all the transformation in the action block is a bit scary. Next week we will look how simple a logstash configuration can be when the format of the log messages is well known.